Lazy Portfolios 2007-2009
This is the home of the Mad Money Machine
Lazy Portfolio Analysis.
The following table shows the Lazy Portfolios from the “Investment Professionals.” They are sorted by 3-year returns from the start of 2006 thru end of 2009. To see the contents of each portfolio, search for the portfolio name on this page.
| Lazy Portfolio | 3 years | 2 years | 1 year |
| Permanent Portfolio Fund (PRPFX) | 21.7% | 8.3% | 18.2% |
| Harry Browne Permanent Portfolio ETFs | 20.1% | 4.6% | 7.5% |
| Bogle Tax-Sheltered | 2.7% | -5.9% | 16.0% |
| Scott Burns’ Couch Potato Portfolio | 1.3% | -6.8% | 18.4% |
| FundAdvice Ultimate Buy & Hold | -2.4% | -9.7% | 19.2% |
| Scott Burns’ Six Ways from Sunday Portfolio | -3.1% | -12.1% | 23.3% |
| Scott Burns’ Margarita (also Andrew Tobias) Portfolio | -3.8% | -13.0% | 23.3% |
| Andrew Tobias’ Lazy Portfolio | -3.8% | -13.0% | 23.3% |
| Ted Aronson’s Lazy Portfolio | -3.9% | -14.3% | 33.3% |
| William Bernstein’s No Brainer Cowards Portfolio | -4.4% | -8.6% | 22.8% |
| Bill Schultheis’ Coffeehouse Portfolio Vanguard | -4.6% | -7.4% | 19.0% |
| Scott Burns’ Five Fold Portfolio | -4.9% | -10.1% | 20.7% |
| John Wasnik’s Nano Investment Portfolio | -5.8% | -10.1% | 19.9% |
| Frank Armstrong’s Ideal Index Portfolio | -7.2% | -12.3% | 22.3% |
| William Bernstein’s Basic No-Brainer Portfolio | -7.9% | -12.9% | 19.9% |
| David Swensen’s Lazy Portfolio | -8.1% | -12.6% | 23.0% |
| Bill Schultheis’ Coffeehouse Portfolio Three ETF | -8.4% | -12.7% | 19.5% |
| Bill Schultheis’ Coffeehouse Portfolio ETFs | -8.5% | -9.0% | 17.5% |
| Scott Burns’ Four Square Portfolio | -11.0% | -14.6% | 24.5% |
| Jim Lowell’s Sower’s Growth Portfolio | -11.8% | -19.1% | 33.3% |
| Merriman Vanguard Equity | -15.9% | -20.9% | 32.4% |
| MMM SMILER Funds | -16.1% | -20.1% | 37.2% |
| IFA Index Portfolio 100 Bright Red | -18.7% | -20.7% | 33.4% |
| MMM Do It Yourself Funds | -17.5% | -20.4% | 33.5% |
| MMM Do It Yourself ETFs | -19.5% | -21.2% | 31.6% |
| Ben Stein Retirement | -34.0% | -24.3% | 19.7% |
| Ben Stein 2007 | N/A | -16.2% | 26.9% |
| WisdomTree | N/A | -21.9% | 28.0% |
| (Results computed via Yahoo! Finance except IFA from ifa.com.) |
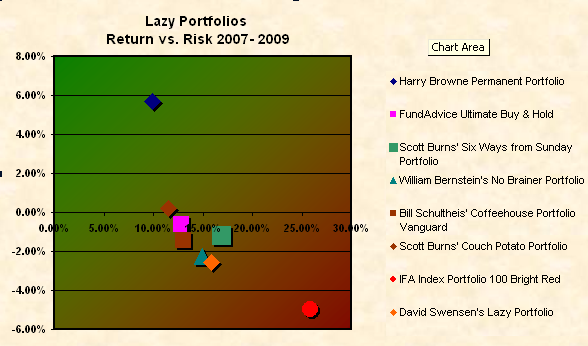
Here is a chart for a select few portfolios showing their 3-year annualized return vs. risk where risk is measured as the portfolio’s annualized standard deviation.

You can discuss the Lazy Portfolios at the Bogleheads forum.
Note these numbers probably have errors and would not include reinvested dividends received after 4 Jan 2010. Data comes from Yahoo! Finance historical quotes and includes adjusted returns. IFA data comes from ifa.com.
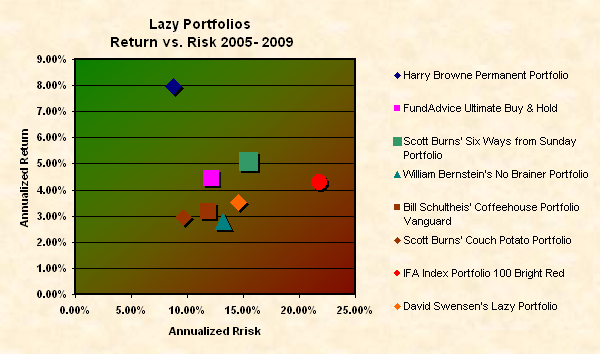
Let’s add a couple more years and include 2005 and 2006:

The HBPP held up nicely even during years of high equity returns. Due most likely to the fact that gold was rising dramatically as well. The HBPP had an annualized return of 8% for the 5 years with an annualized standard deviation of 8.8%. And if we assume a risk-free rate of return of 1.37% for the period (not likely) then that computes a nicely high Sharpe Ratio of 0.75. Remember that the Sharpe Ratio is basically a numerical measurement of “top-leftedness” which is something we can simply see by looking at the chart.
Other postings that may be of interest to you:
- Lazy Portfolios Thru June 2010 – Lists the contents of the lazy portfolios
- Max Drawdown in Lazy Portfolios 2001 – 2009
- Two and 3/4 Years of Lazy Portfolios
