2011 Lazy Portfolio Results (Preliminary)
Another year bites the dust and Harry Browne once again wins.
Here are the Lazy Portfolio Smackdown results for 2011. Note: these numbers are preliminary because mutual fund dividends have not yet been reported. So those lazy portfolios that hold mutual funds that pay dividends in mid to late December will probably end up about 1% higher than these numbers.
Incredibly, the Harry Browne Permanent Portfolio wins again. It beat all other non-permanent portfolios by at least 5.5%! Have a look at the chart:
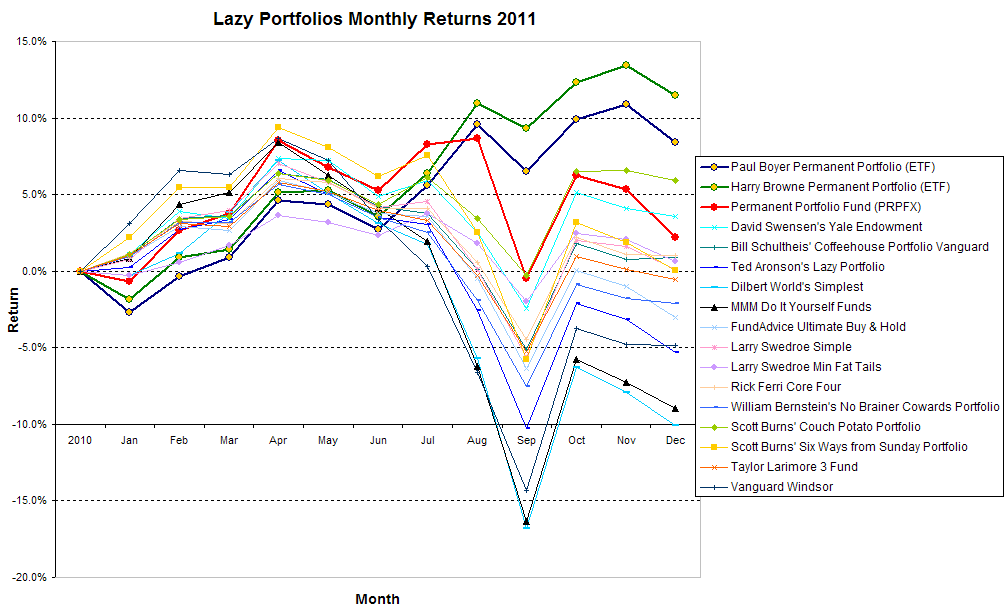
Click on the image to get a larger, more readable graphic.
To see the components of each Lazy Portfolio, visit the Professional Lazy Portfolios page.
Look how steadily the Harry Browne Permanent Portfolio (HBPP) gained during 2011. Especially when compared to the rest. Look at the wild ride they would have put you through from April until September. Tough to stomach that!
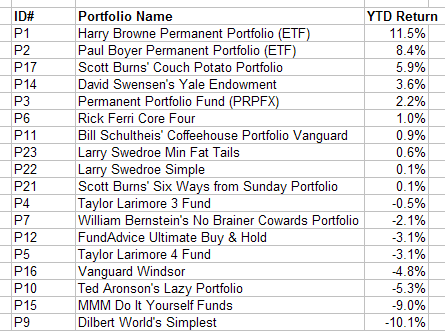
And for those of you who love a more tabular look:
Breaking down the HBPP, here are how the individual components performed for 2011:
 WOW, who would have thought that long-term treasuries would go up 34%? And look at gold, up almost 10%, which also marks its 11th consecutive year of gains. Holy bullion Batman! Even cash money did you better than your bank account, up 1.4% in short-term Treasuries.
Thank you Harry Browne!
How about the losers? Well, the silly Dilbert portfolio, all stocks, dropped almost 10%. Scott Adams recommended this (google it), but it is pretty dumb. Not much less dumb is the portfolio I put out a few years ago, also all stocks, that sought to mimic the IFA Portfolio 100, their riskiest plan. So in a year when risky stocks did poorly, portfolios that invested in all risky stocks stunk.
How about something more reasonable? Good old Rick Ferri, the guy who says his “best investment in gold was his wedding ring” how did he do for you in 2011? Here is his portfolio (prior to December dividend reporting)

He puts 40% into a broad bond index, thinks REITs are cool, and adds some international equities for spice. The portfolio gained you less than if you had put the whole thing into SHY, the short-term treasuries fund. (But dividends for December are still coming) That’s pretty stinky. And as you can see from the chart, you got a pretty wild ride in 2011 to boot. And he makes money doing this?
Which non-Permanent Portfolio did best in 2011? That would be the Scott Burns Couch Potato Portfolio, up 5.9%. (And remember that December dividends aren’t yet included in this result.)
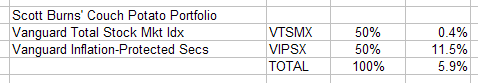
Two funds: stocks and TIPS. Stocks flat-lined. TIPS made you some money. And the ride wasn’t too wild, especially when compared to the others. But HBPP was better in both performance and risk.
I don’t want to wrap up this year-end review without mentioning the poor performance of PFPFX, the Permanent Portfolio Fund. With HBPP up 11.5%, you’d expect that the mutual fund loosely based upon his philosophy would be close to that, but you’d be wrong. PRPFX was up only 2.2% (including December dividends) for 2011. Why? Because it deviates from HBPP in risky ways including Silver, Swiss Francs, and growth stocks. And of course it has a 0.77% expense ratio for its management fees. That is disappointing. But THEY got $118 million, based upon having $15.4 billion invested. I’m not liking this.
Gee whiz, I wish I could create a mutual fund that invested in VTI, 30-year Treasuries, IAU, and short-term Treasuries. I’d pay something like 0.08% and would charge you people 0.20%. Let’s see, with $15 billion dollars under management, I’d take in $18 million each year. Easy money!
 Join us on Facebook
 Follow us on Twitter