Defending Lazy Portfolios Even in Bad Times
I see that Andrew Horowitz over at the Disciplined Investor has taken a look at our Lazy Portfolio Smackdown and thinks that it is idiotic. He says, "How can anyone, even in the best of times, believe that simply throwing money into a few funds and forgetting about them is prudent?" Perhaps even more telling is his lead statement, "Lazy Portfolios has to be one of the most ridiculous investment strategies that has ever been invented."
So let me outline a few points that need to be understood in order to discuss this rationally.
The Lazy Portfolio Smackdown was set up to compare the return vs. risk characteristics within index investing. We did not compare index investing vs. other strategies. However, in 2006 we did run a comparison against a stock-picking strategy. We compared Jim Cramer’s buy buy buy stocks against two lazy portfolios, one with ETFs and one called the IFA Index Portfolio 100 . The lazy portfolios gained over 20% that year and the stock-picking portfolio was -0.2%. But that’s just me, not a scientific study. Let’s move on.
He asks, "what is the point of standard deviation in this table?" Yes, it is shown over one year here. The context is that we are comparing the volatility of an investment vs. the return it generates. After all, risk is the source of returns. Why use standard deviation? It helps us compares apples to apples. It is a good way to compare the performance of a 100% equity allocation against a 60/40 equity/bond allocation, for example. The 100% equity is expected to have a higher risk than the 60/40 split. But what if both portfolios had the same return? Obviously the 60/40 would have been a better choice. Said another way, there must be something wrong with the composition of the all equity portfolio.
But I do caution that looking at portfolios over just a one year period is not sufficient. We really need to look at much longer time frames to statistically capture the correlation of return to risk. But this is also the escape hatch of active managers. If they are lucky one year, they tout their "out performance" as proof they know something. Why do we never hear from the "under-performers?" Very few of active managers have long term records of performance. And of those that do, fewer still have outperformed the market. In fact, I don’t know of any who have. Remember Bill Miller of the Legg Mason Value Trust fund (LMVTX) who was the only manager to outperform the S&P 500 for 15 consecutive years? Have a look at a chart of LMVTX for 2008. His long-term returns are completely wiped out.
Let me answer another way. The standard deviation is used to calculate the Sharpe Ratio of the portfolio. The simplest definition of this ratio is that it measures "top-leftedness" of a portfolio when plotted on a chart of return vs. risk. As return goes higher on the y axis and risk gets larger going right on the x axis we want our portfolio to be top left as far as possible. High returns at low risk is the ideal.
Here is a return vs. risk chart of some of the Lazy portfolios in 2008:
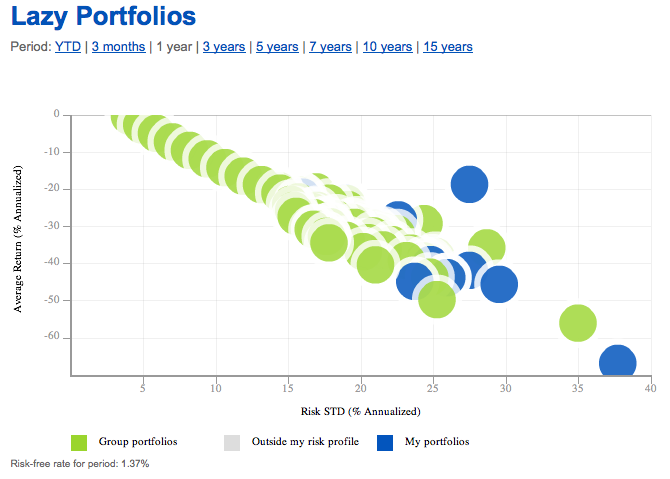
Source: Foliodex.com (when it works) You can see a pretty tight correlation between risk and return.
Remember that risk also measures the potential losses in a portfolio as well as the potential gains. The higher the risk, the higher the potential magnitude of both losses and gains. Sure the Lazy Portfolios had large losses in 2008. But compared to what? Freddie Mac? GE? AIG? GOOG? Or how about these gems from one of Andrew’s posts at the beginning of 2008. He says, "It is a good time to look for deep value…" while cautioning not to chase yield.
| Symbol | 2008 return | 2008 risk |
|---|---|---|
| ACAS | -89.1% | 81.4% |
| ABK | -94.9% | 242% |
| CZN | ? | ? |
| WIN | -22.8% | 42.7% |
| WB | -86.3% | 127.2% |
| DDR | -86.5% | 80.8% |
| AIV | -51.5% | 65.8% |
| NYT | -55.9% | 45.9% |
| EQ | -22.3% | 37.6% |
| LEG | -7.8% | 45.4% |
| GGP | -96.7% | 91.2% |
| PFE | -17.0% | 18.4% |
| EQR | -14.0% | 31.8% |
| AEE | -34.5% | 27.0% |
| PGN | -12.9%% | 12.5% |
I skipped some of the banks in his "screen" just to save time. What would these stock picks look like plotted on the chart above? Pretty much bottom right. Some would be completely off the chart both bottom and right.
But let’s say you were an absolute genius and picked the five best of these and invested your portfolio there. With 20% in each of LEG, PFE, EQR, PGN, WIN I calculate a 2008 return of -14.9% with a risk of 23%. Looking that up on the chart, it would indeed have been better than most. So, what are the chances you would have been a genius and picked the absolute five best? And when should you sell? You have to be right twice, remember? What if, instead, you picked a couple of the worst stocks?
I mentioned that risk is the source of returns above. But keep in mind that there are various types of risk: unsystematic and systematic are two. Systematic risk refers to the risks of the entire market as opposed to the unsystematic risks specific to one stock. Unsystematic risk is not rewarded. Investing in the stock of a single company adds only risk but not return. Better to invest in a market portfolio which minimizes the unsystematic risk of any one particular company. Take a look at this reward vs. risk chart over a period of 20 years. It compares a market-based approach vs. picking individual stocks. Remember that you want to be top-left. Sure, MSFT had higher returns, but would you have been able to put your entire net worth in that one stock and ride its volatility? Even the entire Dow Jones underperformed portfolios 50 thru 100.
What portfolio of stocks can you pick that go further top left than in that chart? And at what effort? If being lazy yields such great reward vs. risk characteristics, why waste time, energy, bid/ask spreads, commissions, tax consequences, and other expenses doing anything else?
Why would someone be so antagonistic towards lazy portfolios when it can be shown they have the best return to risk ratio over the long term? Let’s look at the economic incentives of holding different positions on investing. If someone wants to make money in the investing business, would they try to come up with a unique angle and give their clients the impression they know something that everyone else does not? Or would they follow a scientific approach that most everyone else already knows? Most try the former, thinking it appeals to clients who are seeking answers.
If one were to make commissions from trading stocks, would that person advocate trading or not trading? If one were to make a fee from assets under management, would that person ask you to invest with them or would they say you can do it yourself? Sure, some people don’t want to do it themselves. In that case they need an advisor that can assess their risk capacity and place their investments in a portfolio of index funds.
If one were to write a book on investing, would they try to come up with unique strategies to outperform the market or would they simply tell people to invest in the market? You know there have been studies of active managers showing that the odds of them beating the market over the long term are about 1 in 38, the same odds of picking one number on a roulette wheel? But of course your manager is the one that beats the market, right? Hey, maybe he actually did beat the market last year. Everyone floods into his fund or firm. Like Bill Miller’s or Bernie Madoff’s. It is what happens next that sickens.
When one takes a rational look at Lazy Portfolios, one can hardly call them "idiotic." Unless of course one is in the business of making money trading stocks on behalf of others.
 Join us on Facebook
 Follow us on Twitter