FANTASTIC TOOL: FOLIODEX.COM. Agent 99. My rant on pennies and nickels. An Obama nation? He whose name shall not be spoken wants to rally. Emailers. Guru’s new book. Save keystrokes. 1984.
I ENCOURAGE you to Download this show thru iTunes! 
But, if you just cannot deal with that then go ahead and
Play the new show right now
The Mad Money Machine is proud to be
sponsored by Index Funds Advisors at ifa.com.
Topics in this week’s show include: 
- Show number 99 celebrated with Toto’s 99. Whoops, some of you folks don’t like music. Get Smart the movie will be out this spring.
- Get rid of pennies and nickels? Better yet: get rid of a decimal place!
- Obama thinks that when you keep your own money that what it really means is that it is taking money from social programs. They think estate taxes are great for the gobmint because, after all, the guy’s DEAD, so let’s go get his money!
- Presidential candidate HE WHOSE NAME SHALL NOT BE UTTERED wants a march on Washington to help reach the Remnant.
- Yahoo! TechTicker is up and running and Jim Rogers was an early guest. Thanks to an Email from Paul in Rhode Island for alerting me.
- Garen recommends the book The Economic Naturalist by Robert H. Frank. Fun to read especially if you don’t have a BS degree in economics. Garen also asks about Harry S. Dent, the demographic stock forecaster.
- Barry in Newfoundland wants to know how to get started in index investing for those of us who do not have the type of capital on hand to get into the game. Answer: 1) Invest in company-matched retirement plan. 2) Save money. 3) Buy VTSMX or VTMGX for a minimum of $3000.
- Our Guru, Phil DeMuth, writes Ben Stein’s recent books for him and the latest book is a doozy.
- The keyboard shortcut to save you thousands of keystrokes: In the address bar of your browser, instead of typing the full URL (like http://www.ifa.com) just type IFA and then press CTRL-Enter and magic happens! While you are at IFA, take their Risk Capacity Survey. This is absolutely the first step you need to take! Get the free 4-CD set An Audio Journey to Tradeless Nivana.
- Our Tool this week is fantastic. The kind folks at Foliodex.com notified me that they are putting together a tool to help compare lazy portfolios! Check out the current results and compare the Lazy Portfolio Smackdown entries!
- Have you read chapter 2 of Index Funds: The 12-Step Program for Active Investors? Gotta know those three factors!
- Anais Mitchell plays 1984.
Music from music.podshow.com:
ALTA PLAZA – X-RAY DOGS
Runaway Train – Under Feather

Email me: feedback at Mad Money Machine dot com, or comment, or Call me on the Mad Money Machine voicemail line at 206-734-4763
Fri, February 15 2008 » Podcasts » Comments Off on MMM-099: Igniting the Superchargers
Yes, You Can Supercharge Your Portfolio! 2008 by Ben Stein and Phil DeMuth
I admit an initial bias against wanting to like this book. After all, these are the guys who wrote Yes, You Can Time the Market! And I’ve come to the view that you can time the market about as well as you can time the roulette wheel. You have to be right twice each time you try to time the market, both when to leave and when to return. I didn’t read that book, but I think it is wrong anyway whatever it says. Therefore I viewed this latest book by these guys skeptically. So to keep my hands clean and my bookshelf guilt-free, I borrowed it from the library instead of buying a copy.
My skepticism turned quickly to excitement once I got inside. These guys are talking my current passion, Lazy Portfolios and buying the best basket of index funds you can assemble. They are talking return-to-risk ratios. They are talking standard deviations. They are talking uncorrelated asset classes. These guys are going to give me the answer to my question, "What is the Perfect Portfolio?" I flipped pages quickly, impatient to get the answer. Hey, I thought, I may want to actually buy a copy of this book. I want to keep a permanent record of the answer.
I got an answer alright. But it wasn’t what you might expect. But let’s start at the beginning and set the stage before I give you the answer. The authors lay this portfolio supercharging process out in what they subtitle as Six Steps for Investing Success in the 21st Century. The first few steps start typically. Know what you are buying. Diversify. Know your risk. Diversify. And so forth. Some nuggets embedded within are particularly appropriate to lazy portfolio investing. Such as the notion of dividing the annualized historic return by the annualized standard deviation resulting in the return-to-risk ratio. On my Lazy Portfolio graphs, those portfolios with a high return-to-risk ratio would be plotted at the top left of the chart just where you want to be.
What the authors never told me though is that there is another well-known return-to-risk ratio measurement called the Sharpe Ratio. And they never told me that the Sharpe Ratio can be easily found at finance.yahoo.com for most any mutual fund ticker you can type, such as for VGPMX for example. Instead, they told me to go and buy a program called Quantext Portfolio Planner (QPP) and calculate some funny things myself. I’ll get to this in a second. Let’s return to my excitement.
You’ve seen that I’ve been tracking a number of Lazy Portfolios by professional investing gurus. So naturally when I saw Table 4.3 listing the Couch Potato, Margarita, Six Ways from Sunday, Diehard, Coward, and Coffeehouse portfolios, I knew it would be a late night staying up with this book to get to the answer. And this table confirmed what I have also witnessed, that the Six Ways from Sunday portfolio developed by Scott Burns has outperformed all others and by a nice margin. How exciting it was to see that in the very next chapter the authors take this Six Ways portfolio and Supercharge it using a Monte Carlo simulator. Wow, do even better than the best portfolio? Let me call my broker just as soon as I get the answer.
How can we do better? They assert that we can find higher return-to-risk portfolios by adding in investments that are non-correlated and that themselves have high return-to-risk ratios. So when you’ve run out of non-correlating, high return, low risk index funds, where do you turn? Shockingly, the authors suggest that we turn to individual stocks. So help me Cramer that’s what they said. But first we need tools. Tools will help us get the answer.
Right. So after detailing the benefits of diversification and non-correlated asset classes, the authors take us into the land of the Monte Carlo simulation. (How appropriate that in the real Monte Carlo they have roulette tables.) This is the point where the authors introduce us to the QPP Monte Carlo simulator which is basically an Excel spreadsheet for $85 per year that pulls historical fund quotes from Yahoo! Finance and runs some stats and simulations against them. Hey, haven’t I heard of something like this before? Oh yeah, the Stock Market Functions Add-In and the RCHGetYahooHistory function that I use to calculate annualized standard deviations on portfolios in Excel. But of course their tool does much more than standard deviations — they do Monte Carlo simulations! Which are what, exactly? The authors say a Monte Carlo simulator:
uses a computer’s random number generator to construct sample sequences of future returns. After spawning thousands of possible scenarios for a given portfolio, the shape of its financial future begins to take form.
Most important, Monte Carlo simulation can put different portfolios through the same set of paces, letting us make head-to-head comparisons… It’s an effective tool to sharpen investment decisions.
Basically, the simulator looks at the range of past results for each fund and then rolls a matching set of dice thousands of times to see the range of possibilities that could happen to the whole portfolio in the future. It’s magical! I guess, since the authors don’t show any supporting facts that having run Monte Carlo simulations in the past have actually resulted in good things happening in the future. Let’s just believe that we can run this QPP and get a better idea of success than by just simply looking at past Sharpe Ratios, OK?
But what if your range of historical past results is too short? For example, let’s say you are trying to figure out the range of possible values of five dice rolled together by rolling them many times. These guys effectively rolled the five dice just 36 times. Dudes, you’re going to need a lot more than that to predict the future possibilities. That is one flaw in what the authors are showing here. They used only three years of historic data to show returns and standard deviations for assets. And even worse, the three years they chose were from 2003 to 2006, a major bull market in stocks. Any monkey would make money by buying stocks in 2003, so come on.
A further flaw: they don’t elaborate on exactly what percentage of risk, what standard deviation of a portfolio, that one should buy into. They do say that "risk is not psychological" and that we should not be talking about risk tolerance, we should be talking about "running out of money tolerance." But that is basically where they leave it. For listeners to my show and readers of this blog, you’ll know that the first step is to take the Risk Capacity Survey at IFA.com. It will give you a better idea of what risk level you should seek. Then Index Funds Advisors can help you build a portfolio to match that risk level.
But the biggest flaw of all is in back-testing individual stocks to try to find ones that will do better than the market. They think that by adding 10% individual stock picks you can make your portfolio have a higher return with a lower risk. Keep dreaming guys. I’d guess that of the folks that try this, that 45% will beat the market and that would be just by sheer chance alone. Kind of the same success rate of picking Red to win on the roulette wheel, wouldn’t you say? And that margin of "beating the market" is so slim that it would have been a much wiser use of one’s time to sell one’s old junk on Ebay or something.
But oh what a price to pay to try to achieve that slim margin. First, you have to buy their book. Second, you have to buy this spreadsheet tool. Then get it working. (I obtained a trial copy. It did not work immediately. It did not work after I tried a couple of things. I did not pursue it further. It must work for someone because the authors report its results extensively.) Third, you have to spend time guessing which stocks to pick. Then you have to buy the stocks. Then you have to monitor the stocks. Then you panic and wish you had bought different stocks.
Finally you come to the realization that just sticking purely with index funds is the right way to go. Which brings us to the answer: No, you cannot supercharge your portfolio!
Here are some other relevant quotes to consider when deciding whether to use 3 years of data to create a Monte Carlo simulation:
"Statisticians will tell you that you need 20 years worth of data — that’s right, two full decades — to draw statistically meaningful conclusions [about mutual funds]. Anything less, they say, and you have little to hang your hat on. But here’s the problem for fund investors: After 20 successful years of managing a mutual fund, most managers are ready to retire. In fact, only 22 U.S. stock funds have had the same manager on board for at least two decades–and I wouldn’t call all the managers in that bunch skilled. "
by Susan Dziubinski, University editor with Morningstar.com
Note: Index Funds are the only source of reliable 20 year risk and return data.
And since picking individual stocks essentially turns you into a portfolio manager:
"Studies show either that most managers cannot outperform passive strategies, or that if there is a margin of superiority, it is small." p. 372-b.
"It will take Joe Dart’s entire working career [calculated to be 32 years] to get to the point where statistics will confirm his true ability." p. 821 - c.
"In the end, it is likely that the margin of superiority that any professional manager can add is so slight that the statistician will not easily be able to detect it. " p. 374
Zvi Bodie, Alex Kane, Alan J. Marcus, Investments, Fifth Edition, McGraw-Hill (Thanks Mark Hebner for the quotes.)
I feel the sudden urge to write a book entitled, The Quest for the Perfect Portfolio in which I will compare all of the Lazy Portfolios and try to construct THE ONE portfolio appropriate for everyone by simply adjusting the percentage of bonds vs. stocks. Oh, wait a minute, Mark Hebner has already done that: Index Funds: The 12-Step Program for Active Investors.
Feel free to read comments at the blog.
Thu, February 14 2008 » Reviews » Comments Off on The Quest for the Perfect Portfolio
The CBS show 60 Minutes did a segment about the penny. You can watch Should We Make Cents? or read the transcript. Bottom line is this: the gobmint makes $80 million worth of pennies every year. But the problem is that it costs the gobmint $134 million to make them. Not bad if you’re a zinc provider. Bad if you are a taxpayer. Bad for inflation. And guess what, that cost probably ain’t going to go down. Same thing with the nickel. They make $65 million worth of nickels every year. But it costs $124 million to make them. Stop the insanity! Say goodbye to the penny and nickel. How?
Dear friends, it is time to get rid of a decimal place. I know, I know, you love your precious two decimal places. $14.95. $19.99. Or even $1.00. Well I have a proposal that will save all us taxpayers a lot of money in zinc costs: Get rid of a decimal place! This actually works out in favor of the consumer because now prices would be $14.9 and $19.9 on the same items. No need to round up! Get rid of nickels and pennies. The only use for a nickel would be if you had two of them. Similarly for a penny, you could only buy something if you had ten of them. Eventually the lowest useful coin becomes the dime. And the gobmint could even fashion new dimes with Jefferson and Lincoln on them as an homage to our lost coin friends.
Our pockets would be lighter, our gobmint would save $113 million each and every year by not having to make these coins. That works out to be $1.3 billion after ten years and probably much more owing to the rising cost of zinc and copper (or said more properly, the lowering value of the dollar). Just think what we could do with $1.3 billion… reduce taxes!
Mon, February 11 2008 » Predictions » Comments Off on Dime is the New Penny?
I don’t know if anyone ever reads comments to the blog postings, so I will think about raising some of them to the level of a posting itself. Here’s the first example:
wizkid writes in Some Lazy Portfolio Entries Backtested:
OK – Ready to audit the calculations.
Please define the calculation of Return and Risk using the multiple periods.
Is return – average annualized return, compounded return with reinvesting dividends, rebalanced annualized return, etc. etc.
Is the risk based on monthly returns, monthly rolling etc.
Explain the reason for the timeframe – why Aug 2000 as the start date?
Great job on comparing the portfolios!
To which I replied:
Oh excellent! Love a 2nd pair of eyes.
I started with August 2000 because if I went back further in time, VIPSX (Vanguard Inflation Protected Securities) didn’t exist prior to that (at least according to Yahoo). And it is used in several portfolios.
I pull monthly “Adjusted” historical stock quotes from Yahoo finance (using that free tool RCHGetYahooHistory) These presumably account for reinvested dividends and for things like splits.
I calculate but do not report the annualized return and annualized risk for each fund. Then I also calculate and report the total portfolio’s return and risk, as below:
Five columns are used in the spreadsheet for each fund:
Date, Adj Close, Normalized, Gain, Value
Date = the first trading day of each month
Adj Close = the funds value brought back from Yahoo including (subtracting) reinvested dividends
Normalized = first month, fund value starts at 1. Each subsequent month therefore shows the total gain
Gain = delta in the value between each month. This is used to calculate the annualized standard deviation.
Value = this fund’s contribution to the total portfolio. Basically, multiply the Normalized column by the fund’s percentage in the portfolio
Then to compute the returns and risk on the total portfolio, I add up all the Value columns for each month, calculate another monthly gain difference column for the total portfolio, compute the total annualized standard deviation, and report the annualized return as:
=+(Last value/First value)^(1/((End date-Start date)/365))-1
I calculate Annualized Standard Deviation as
=STDEV(RANGE*SQRT(12)) where RANGE is the gain column (each monthly difference in value).
It takes about a minute for the spreadsheet to load as it draws all the stock histories from Yahoo.
I DO NOT PERFORM REBALANCING. I should probably do this, huh? Will have to think about how to code it up in Excel.
Suggestions for improvement greatly welcomed.
Sun, February 10 2008 » Blog » Comments Off on Auditing Lazy Portfolio Calculations
From the 66 entries in the Lazy Portfolio Smackdown game, I have taken these 19 portfolios in which all component funds existed back on 1 August 2000 through 31 January 2008 and computed their Return vs. Risk profile. To see the components of each portfolio, go to the Portfolios page and find the ID number for the portfolio. [Note, in some cases I substituted regular index funds for Admiral shares, mutual funds for their ETF equivalent, or other similar but not identical funds… such as VGSIX for FIREX in one case. And on lew’s portfolio I cheated and started PCRIX (PIMCO CommodityRealRet Strat Instl) on 1 Jan 2003.]
| ID |
Lazy Portfolio |
Return |
Risk |
| 1 |
CyberBob |
4.39% |
6.80% |
| 5 |
Jarrod |
7.81% |
11.30% |
| 8 |
james22 |
6.26% |
14.11% |
| 10 |
mikenz |
7.90% |
9.47% |
| 13 |
poulinbob |
16.68% |
19.57% |
| 16 |
HAZEL |
7.64% |
4.89% |
| 17 |
Justin617 |
7.98% |
10.64% |
| 19 |
sgr000 |
7.12% |
10.30% |
| 22 |
Sunny |
4.24% |
7.78% |
| 24 |
MrBG |
7.15% |
8.36% |
| 33 |
DR |
4.52% |
14.10% |
| 38 |
lazyrad |
5.05% |
15.37% |
| 39 |
gflippin |
3.70% |
5.38% |
| 41 |
Kevin Ucker |
12.67% |
13.89% |
| 45 |
Bev and Mike Cote |
7.56% |
4.99% |
| 51 |
Jennifer & Mark |
11.40% |
10.62% |
| 54 |
lew |
10.69% |
13.20% |
| 59 |
Cosmo |
5.02% |
2.35% |
| 60 |
TnGuy |
11.10% |
13.37% |
The graph below plots the values from the above table. The best place to be is top and left. Note how you could almost draw a line from bottom left to top right. That would be the efficient frontier line. The idea is that the more risk you take, the more you should be rewarded. If a winner were to be awarded in each of three risk bands (0-8%, 8-16%, and 16%+) based upon this graph it looks like HAZEL, Jennifer & Mark, and poulinbob would each get a copy of Index Funds: The 12-Step Program for Active Investors. Although Kevin Ucker and Bev and Mike Cote have it going on too.
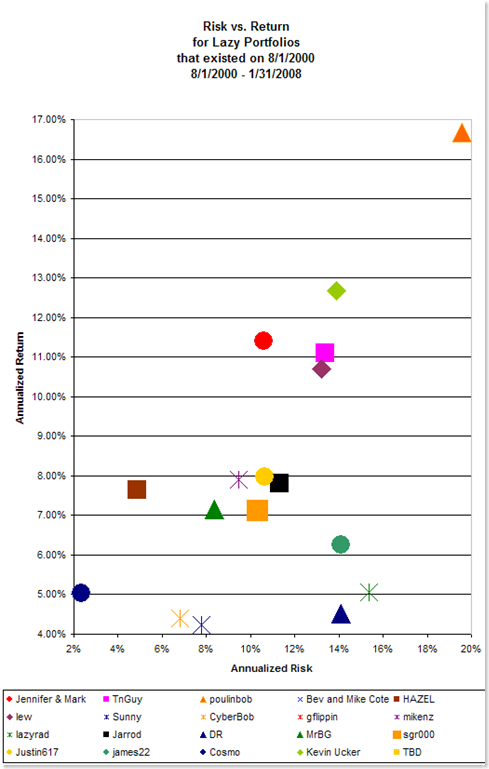
It is worth comparing these results with the Professionals I showed in a previous posting.
And just to see what you would have gone through in the past one year, here is how the portfolios did since the start of 2007:
| ID |
Lazy Portfolio |
Return |
Risk |
| 51 |
Jennifer & Mark |
23.86% |
9.89% |
| 60 |
TnGuy |
13.15% |
13.66% |
| 13 |
poulinbob |
12.10% |
16.37% |
| 59 |
Cosmo |
8.18% |
2.05% |
| 45 |
Bev and Mike Cote |
7.86% |
3.51% |
| 16 |
HAZEL |
6.21% |
3.40% |
| 54 |
lew |
5.88% |
11.56% |
| 22 |
Sunny |
3.61% |
6.77% |
| 1 |
CyberBob |
2.98% |
7.09% |
| 39 |
gflippin |
2.67% |
5.29% |
| 10 |
mikenz |
1.21% |
9.43% |
| 38 |
lazyrad |
0.57% |
13.08% |
| 5 |
Jarrod |
0.10% |
10.55% |
| 33 |
DR |
0.03% |
12.91% |
| 24 |
MrBG |
-0.05% |
7.33% |
| 17 |
Justin617 |
-1.44% |
9.74% |
| 19 |
sgr000 |
-1.48% |
8.92% |
| 8 |
james22 |
-2.18% |
11.78% |
| 41 |
Kevin Ucker |
-14.23% |
12.12% |
Fri, February 8 2008 » Blog » 2 Comments
Are you part of The Remnant? Super Tuesday results. Wesley Snipes. IRS cost basis reporting. David calls in. How about a podcast with the four independent guys? Capitalism. Lazy Portfolio Smackdown review.
I ENCOURAGE you to Download this show thru iTunes!
But, if you just cannot deal with that then go ahead and
Play the new show right now
The Mad Money Machine is proud to be
sponsored by Index Funds Advisors at ifa.com.
Topics in this week’s show include:
- Results from Super Tuesday
- Call the voicemail line to support show #100
- Take the Risk Capacity Survey, then buy a copy of Index Funds: The 12-Step Program for Active Investors
- Wesley Snipes was found not guilty of tax fraud. But was convicted of misdemeanor accounts for failure to file a tax return. Pres Bush wants to make that a felony now. Congrats Wesley.
- Gobmint may make law requiring brokerage firms to report your cost basis.
- David from The Fast Money Machine calls in with two questions. Why hold MSFT and worry about the taxes?
- Listener, what do you think? Should the four of us top independent investing podcasts (including Andrew Horowitz The Disciplined Investor and Brian Preston The Money-Guy) team up to make a podcast?
- Our Guru‘s Reality Guide has 10 questions to help you find out if you are a member of the Remnant.
- Jack writes about Capitalism. Is it in trouble? He cites two interesting sources: The Story of Stuff and Marketplace – American Public Radio Consumed. Mark Hebner has always said there are only two times when you should sell funds from your portfolio 1) When you need the money or 2) When you lose your faith in capitalism. Note that if #2 happens, we probably have bigger things to worry about!
- I review the Lazy Portfolio Smackdown both for one month and for over seven years.
Fri, February 8 2008 » Podcasts » Comments Off on MMM-098: Reaching the Remnant
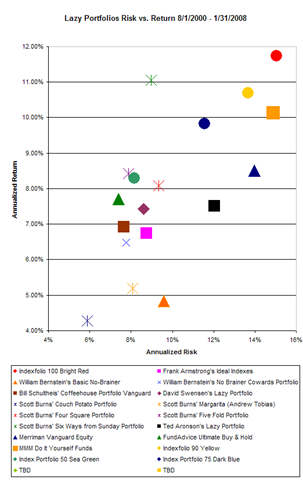
At the Lazy Portfolio Smackdown page, I have put in a table showing the returns of all entries into the game thru the end of January. No surprise that most of the portfolios are down. The exceptions being the clever China Bear portfolio and a commodities-heavy portfolio. What I intend to do is to show the standard deviations of these portfolios over the long term. That is hard to do for ETF portfolios, obviously. Here are the long term (well, since August 1st 2000 at least) risk vs. reward results for the professional lazy portfolios that invested in mutual funds.
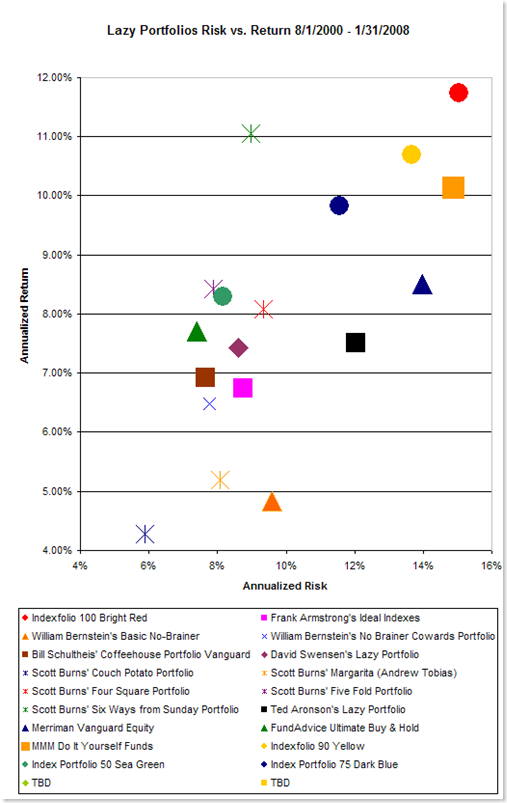
Some of the IFA Index Portfolios are shown in circles. Notice how as the portfolios take on greater risk, they also achieve greater return. Notice how the IFA Index Portfolios generally have greater return for the same amount of risk than the other portfolios. There is a single outlier in the Scott Burn Six Ways from Sunday Portfolio. So let’s take a detailed look at it.
| |
|
|
Return |
StDev |
| Vanguard Total Stock Mkt Idx |
VTSMX |
16.7% |
1.03% |
14.07% |
| Vanguard Inflation-Protected Secs |
VIPSX |
16.7% |
6.99% |
5.81% |
| Vanguard Total Intl Stock Index |
VGTSX |
16.7% |
6.91% |
14.92% |
| Vanguard REIT Index |
VGSIX |
16.7% |
14.58% |
15.08% |
| American Century International Bd Inv |
BEGBX |
16.7% |
9.71% |
8.70% |
| Vanguard Energy |
VGENX |
16.7% |
20.34% |
19.09% |
| |
TOTAL |
100.0% |
11.06% |
8.97% |
This portfolio returned 11% annually with 9% risk. So how did Scott Burns do it? Looks like he got a good return on bonds which have lower volatility than stocks while also getting great returns on REITS and in the specific sector of energy. How did his portfolio do recently? Also, not too bad. As you see on the Lazy Portfolio Smackdown page, the portfolio dropped only -2.91% in January. Again, those bond funds helped cushion the blow.
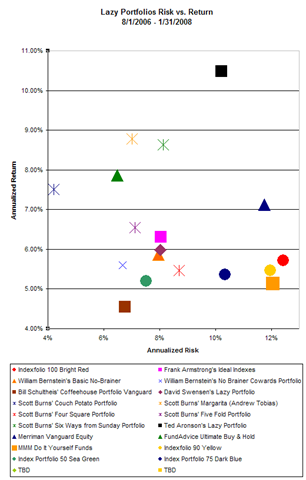
The following comparison takes a look at the portfolios since August 2006. This places more heavy emphasis on the poor performance of REITS and small cap US stocks in 2007. Not fair to compare them on such a short time span, but there it is.
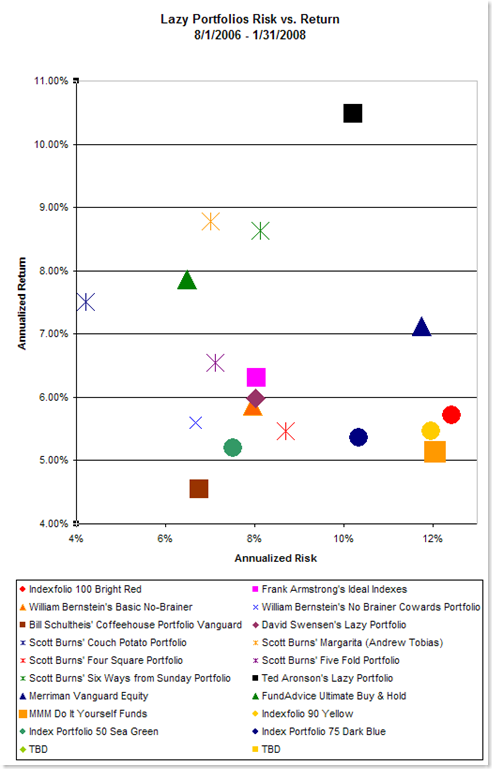
We can see the out-performance of Ted Aronson’s heavily-weighted emerging market portfolio. It gained 10.48% with 10.21% risk in the 1.5 recent years. He has 20% in VEIEX the Vanguard Emerging Markets fund. It gained 28.63% over the period.
You can see the components of all portfolios on the Lazy Portfolio Smackdown page.
Tue, February 5 2008 » Blog » 1 Comment
Change! Could we REALLY eliminate the income tax? Politicians want the change from our pockets. What to do in a recession. Guru says buy China and commodities. Tool for making your own e-book.
I ENCOURAGE you to Download this show thru iTunes!
But, if you just cannot deal with that then go ahead and
Play the new show right now
The Mad Money Machine is proud to be
sponsored by Index Funds Advisors at ifa.com.
Topics in this week’s show include:
- Change: Bag of $1000 face value silver quarters and dimes = $12,501.20
- Tears for Fears – Change
- Change: Should you buy a Liberty Dollar?

- Change: Yahoo’s TechTicker will feature Henry Blodget

- Change: HD-DVD vs. Blu-Ray

- Charge: Some banks charge $3 ATM fees?
- Eric Clapton – Change the World
- Do you agree with me that these would be great CHANGES:
- eliminate taxes on dividends, savings, capital gains, social security benefits, tips and repeal the death tax
- Freeze non-defense, non-entitlement spending at current levels
- televise Federal Reserve meetings
- legalize competing currencies
- repeal Sarbanes/Oxley
- Change: Income tax is only 12% of Federal budget. Eliminate it!
- All of the candidates are saying they want change. What most of them mean is they want the change from our pockets.
- Charge: Paul’s economic advisor to the campaign was last show’s guru.
- I’m hoping that Ron finds someone named Boyer to run as his veep. Then all the signs would say PAUL-BOYER 2008. Heck, I’d even settle for a Douglas.
- Recessions: Lazy Portfolio Guy isn’t so lazy when it comes to saying SELL
- IFA Feature: Recessions
 Out of the last 50 years or 600 months, October 1987 was the worst one month decline in Index Portfolios 15 to 100.

How long did it take Index Portfolios to recover?
IP100: after a 21.79% decline in Oct. 1987?
IP70: after a 16.62% decline in Oct. 1987?
IP50: after a 12.61% decline in Oct. 1987?
IP30: after a 8.12% decline in Oct. 1987?
- The only change you need to make is to rebalance your portfolio annually.
- Our Guru (and also a previous guru) says there’s little trouble investing in big China. China is trying to weather the harsh winter. But you don’t have to buy individual stocks, instead look at VWO, EEM, DEMSX, or a tiny tiny holding in FXI. He also said buy commodities. You can get VGPMX or DBC instead.
- Our Tool helps make your own books for the Kindle! Change: I’m liking my Kindle. I’ll probably read more than two books this year
- Next Friday: Update on Lazy Portfolio Smackdown
- CALL 206-734-4763 AND LEAVE A MESSAGE FOR SHOW #100
Music:
Tears for Fears – Change
Eric Clapton – If I Could Change the World
Music from music.podshow.com:
Runaway Train – Under Feather
Fri, February 1 2008 » Podcasts » Comments Off on MMM-097: Supporting Change
Murry Coleman writes at Index Universe about the new Diehards forum run independently that is overtaking the old forum run under Morningstar’s site. He says Morningstar blew it by "not listening to its customers and has thus lost a lot of luster with index investors." He says of Morningstar:
But in this age of MySpace and Facebook hysteria, it’s odd that Morningstar let so many eyeballs go their own way. In the end, it’s turned out to be a blessing in disguise for investors. The revamped Diehards.org is better organized, easier to navigate and much more intelligently moderated than the older version.
And it’s becoming a true social networking site. There are meet-up groups forming and getting together all the time around the country (something that started over at Morningstar). The Diehards even have their own convention each year, something that IU believes has become a truly major event in the indexing community.
I’ve praised the Diehards forum many times on the show and I still go there and learn new things all the time. There is no place better on the net for the do-it-yourself investor.
Tue, January 29 2008 » Announcements » Comments Off on Live Free or Diehards II
An article in the NYTimes quotes Steve Jobs from Apple talking about the Amazon Kindle eBook reader:
Yet, when Mr. Jobs was asked two weeks ago at the Macworld Expo what he thought of the Kindle, he heaped scorn on the book industry. “It doesn’t matter how good or bad the product is; the fact is that people don’t read anymore,” he said. “Forty percent of the people in the U.S. read one book or less last year.”
Here’s your chance to prove him wrong. You can read TWO books this year. 🙂 And if you haven’t already purchased your Amazon Kindle eBook reader, do so now because I have some more neat things to say about it on upcoming shows.
Two good books I’m reading on it right now are Jim Rogers’ A Bull in China available from Amazon and Human Action: A Treatise on Economics by Ludwig von Mises, which is freely available!
Mon, January 28 2008 » Reviews » Comments Off on Prove Steve Jobs Wrong: Read TWO Books this Year
James in south Florida alerted me to a great feature in the Canadian MoneySense magazine of Feb/Mar 2008 entitled Child’s Play: The Couch Potato Portfolio in which they describe lazy investing and using passively managed index funds instead of actively managed funds. Here’s a snippet:
Let’s say you have a $200,000 portfolio. This year alone you would save about $4,000 by becoming a Couch Potato investor rather than an investor in actively managed mutual funds. Over a few years, assuming you reinvested all of your savings, the difference would grow and grow, because the money you would be saving would compound on itself. Assuming typical rates of return, the money you would save by becoming a Couch Potato would be more than enough to buy you a luxury car in 10 years’ time even if you were never to invest another cent in your portfolio.
There are several links to click around to get the whole story, but they are worth a look. They compare the performance of the Couch Potato portfolio against the Canadian stock index. Hey, I gotta take a look at making sure I own some of that Canadian stock index! (Canadian stocks might NOT be a part of your international index fund!) Thanks James for the tip off.
Mon, January 28 2008 » Blog » Comments Off on Be a Couch Potato

 Amazon.com: Yes, You Can Supercharge Your Portfolio!