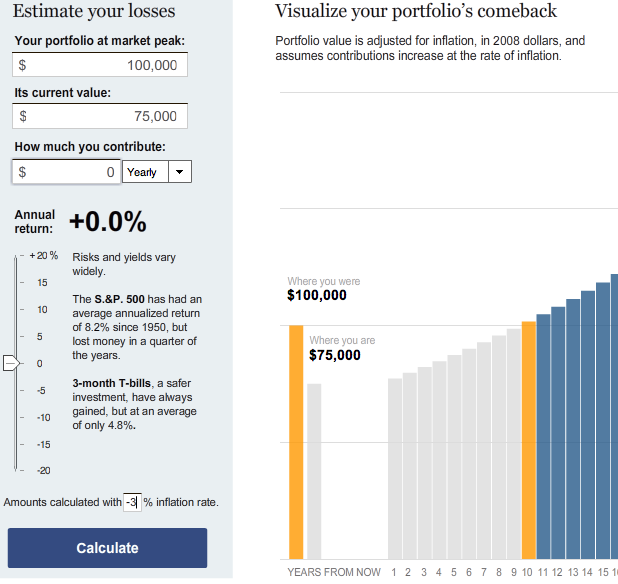
NYTimes has great interactive graphic on getting back to even
Check this out. NYTimes, with its unlimited budget (ha) has gone and done my pitiful "Table of What it Takes to Get Back to Even " several times better. Theirs is an interactive graphic (in Flash no less) where you can enter what you once HAD, what you now HAVE, and your expected return rate (ha again!). It will tell you how long you’ll have to wait to see that same amount of money again.
http://www.nytimes.com/interactive/2009/01/06/business/20090106-comeback-graphic.html
What’s neat is that if you put in a negative inflation rate, say -3%, you can get your money back in a few years even at 0% Annual return!


