Portfolios: Gold or No Gold?
Should a portfolio own gold? I am on the quest to obtain the definitive answer to that question. Here are the results of one exercise in which I take a model Vanguard portfolio and compare it with the same portfolio with a 25% allocation to gold for the time period 1999 through 2009.
Here is the model portfolio composition which is based on the IFA Index Portfolio 25 (source). We will call this the Vanguard 25 portfolio:
| Vanguard Index for Vanguard 25 Portfolio | Symbol | % Allocation |
| Vanguard S&P 500 | VFINX | 7% |
| Vanguard Large Cap Value | VIVAX | 7% |
| Vanguard Small Cap | NAESX | 3.5% |
| Vanguard Small Cap Value | VISVX | 3.5% |
| Vanguard REIT | VGSIX | 3.5% |
| Vanguard Developed Markets | VDMIX | 7% |
| Vanguard Emerging Markets | VEIEX | 3.5% |
| Vanguard Short Term Bond | VBISX | 65% |
I am going to use the time period from 1999 through 2009 for the analysis. Crunching the numbers in Simba’s spreadsheet (Revised with 2009 data added. More info about the spreadsheet at the Bogleheads forum.) I come up with a compound annual growth rate (CAGR) of 5.6% with a average annualized standard deviation (risk) of 7.1%. This works out to a Sharpe ratio of 0.41 for the time span.
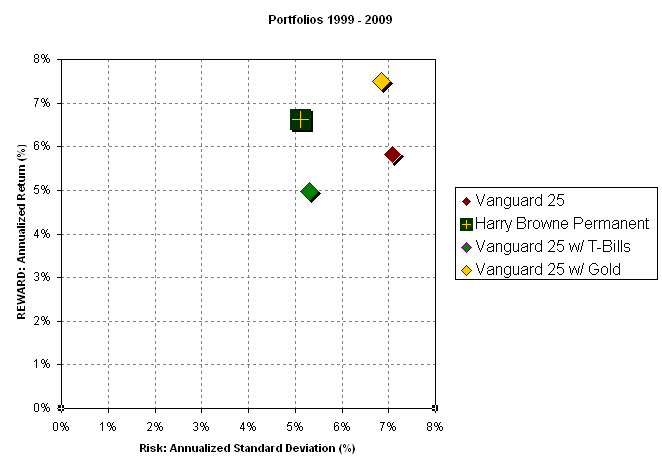
So, what if instead of having 100% of our total investment in the Vanguard 25 portfolio we placed just 75% of our investment in it and placed the remaining 25% in gold? Running the numbers in Simba’s spreadsheet (Simba uses this source for gold’s annual return.) I come up with a CAGR of 7.5% with a risk of 6.9% resulting in a Sharpe ratio of 0.70. Call this one Vanguard 25 w/ Gold. The following chart plots these two results. As a reference I also show on the following charts the Harry Browne Permanent Portfolio which is comprised of 25% each of Total Stock Market (VTSMX), Long Term Gov’t Bond (VUSTX), Money Market (VMPXX), and Gold.
Also shown in the chart is the same exercise but instead of placing 25% in gold we substitute a Treasury bill money market fund (VMPXX) for the 25%. The portfolio with money market fund added resulted in a CAGR of 5.0%, risk of 5.3%, and a Sharpe ratio of 0.41. Call it the Vanguard 25 w/ T-Bills. Note that the Sharpe ratio is the same as the original portfolio because in a Sharpe ratio calculation we subtract out the risk-free rate of return of money markets. So adding money markets to a portfolio does not change the ratio of return vs. risk.
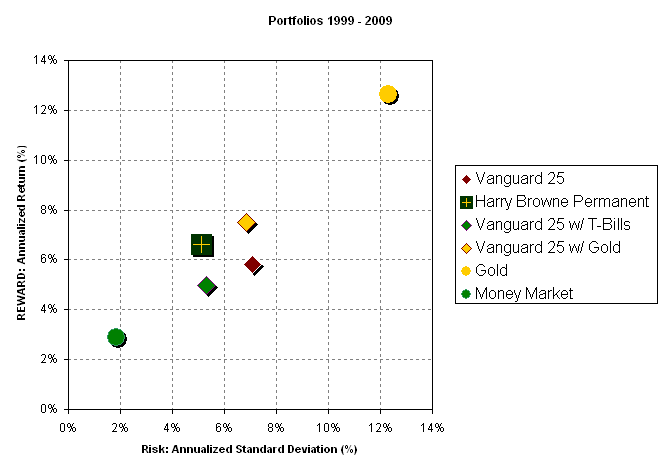
The next chart adds the individual return vs. risk of gold and money market for the same time period showing the higher risk with accompanying higher return of gold for the period.
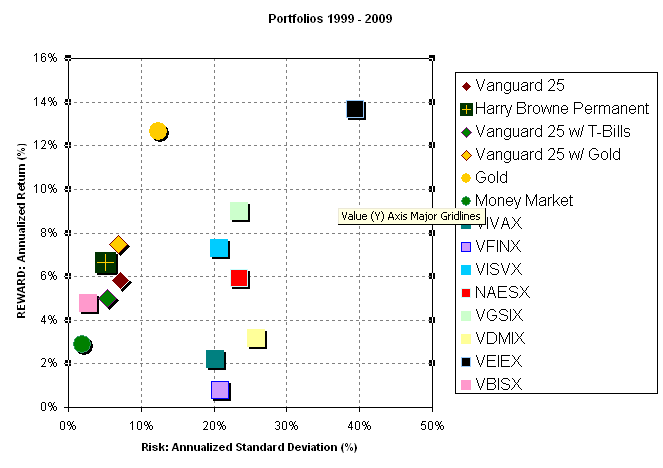
This next chart adds the individual return vs. risk of all of the other components of the Vanguard 25 portfolio for the same time period.
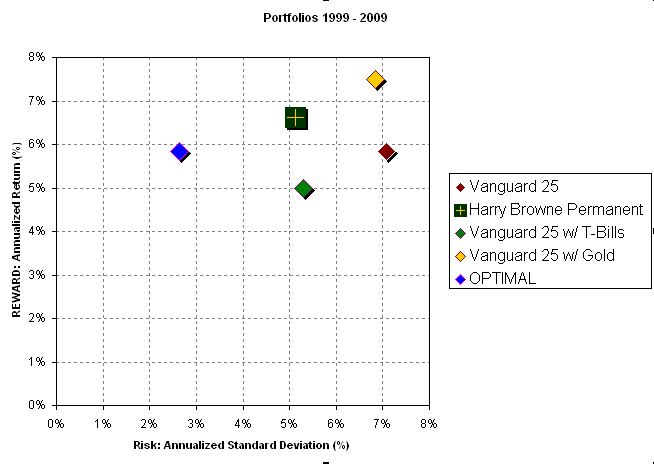
And for the fun of it, I computed the optimal portfolio for the time span based upon the highest Sharpe ratio and as computed by Excel Solver. This tool allows you to specify an attribute you wish to maximize while varying the percentage amounts of the various funds. In this case, we chose to maximize the Sharpe ratio and allow Excel Solver to pick which combination of which funds achieved it. The following table shows the result.
| Vanguard Index for OPTIMAL Portfolio | Symbol | % Allocation |
| Vanguard S&P 500 | VFINX | 7% |
| Vanguard Large Cap Value | VIVAX | – |
| Vanguard Small Cap | NAESX | – |
| Vanguard Small Cap Value | VISVX | – |
| Vanguard REIT | VGSIX | 1% |
| Vanguard Developed Markets | VDMIX | – |
| Vanguard Emerging Markets | VEIEX | – |
| Vanguard Short Term Bond | VBISX | 79% |
| Gold | – | 14% |
The OPTIMAL portfolio resulted in a CAGR of 5.8%, a risk of 2.6%, and the resulting Sharpe ratio of 1.12. Its addition to the first chart is shown below.
How about continuing to optimize with a high Sharpe ratio yet obtaining greater return? To do that I subtracted some short-term bonds and added some gold leaving the other two components the same. That is, gold at 35% and bonds at 57%. This resulted in a CAGR of 7.6%, risk of 7.7% and Sharpe ratio of 0.99 and can be seen in the following chart.
| Vanguard Index for OPTIMAL Portfolio | Symbol | % Allocation |
| Vanguard S&P 500 | VFINX | 7% |
| Vanguard Large Cap Value | VIVAX | – |
| Vanguard Small Cap | NAESX | – |
| Vanguard Small Cap Value | VISVX | – |
| Vanguard REIT | VGSIX | 1% |
| Vanguard Developed Markets | VDMIX | – |
| Vanguard Emerging Markets | VEIEX | – |
| Vanguard Short Term Bond | VBISX | 57% |
| Gold | – | 35% |
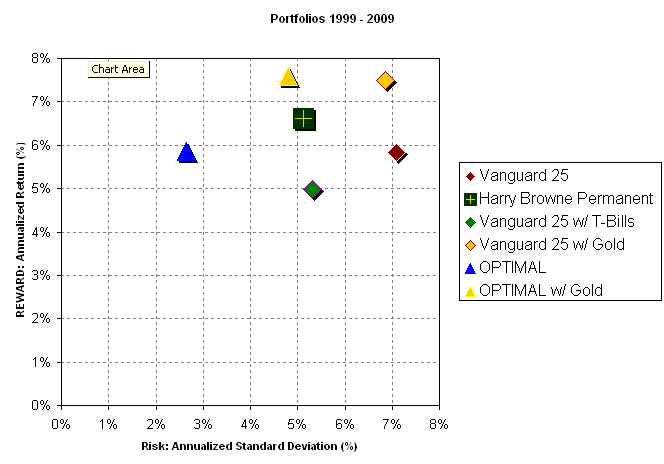
Therefore, to answer the original question, “Should a portfolio own gold?” it appears that for the period 1999 through 2009 the answer would have been a resounding “yes.” We find that adding gold to the portfolio resulted in higher returns with less risk.
I caution that this process is called data mining and should only serve as input into future portfolio analysis and not serve as the only decision regarding future investments. In subsequent analysis I will not limit the possibilities to just the Vanguard 25 fund set but will open it up to Vanguard funds available since 1972 and/or 1985.
Sources: Vanguard.com, Bogleheads.org, IFA.com, and http://www.finfacts.ie/Private/curency/goldmarketprice.htm
