Lazy Portfolio Risk Analysis
You’ve used the IFA Benchmark Your Portfolio tool to review the performance of the Index Funds Advisors portfolios. They give you the return and the risk for each of their 20 IndexFolios over a timespan you select. I thought it would be cool to do the same thing for several of the Lazy Portfolios (click to see the make-up of each portfolio). Remember that nifty tool from a couple of shows ago? The StockMarketFunctions add-in for Excel can grab historical quotes from Yahoo!. Now I’ve developed a spreadsheet where I can plug in up to 10 ticker symbols and the percentage allocation to each stock or fund and then get out the total return for the portfolio and also the annualized risk. What is annualized risk? It is the standard deviation of monthly returns multiplied by the square root of 12. Not sure why it works and don’t really care. Anyway… I’ve plugged in some of the Lazy Portfolios to see their returns and risk for the past seven years, from 1/1/2000 until 10/1/2007. I’ve sorted by return and also sorted by risk.
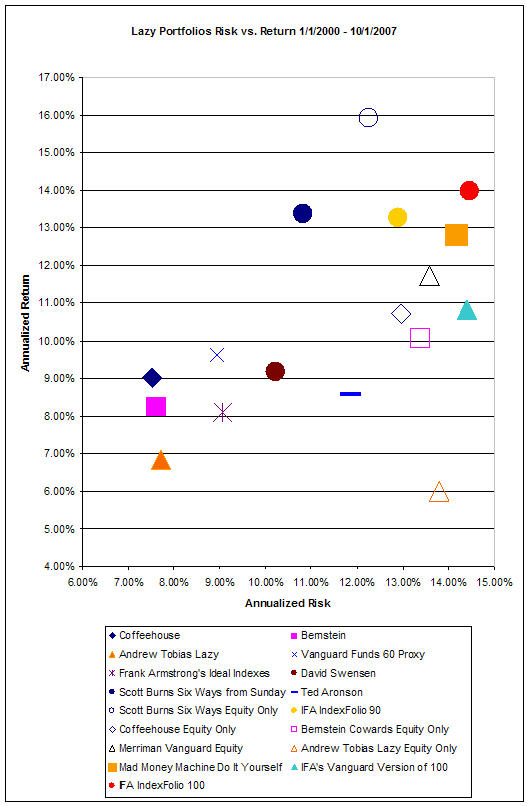
Here’s the result, first sorted by annualized return over the nearly seven years:
| Lazy Portfolio (sorted by Return) | Return | Risk |
| Scott Burns Six Ways from Sunday Equity Only | 15.92% | 12.25% |
| IFA IndexFolio 100 | 13.97% | 14.47% |
| Scott Burns Six Ways from Sunday | 13.39% | 10.81% |
| IFA IndexFolio 90 | 13.28% | 12.89% |
| Mad Money Machine Do It Yourself | 12.82% | 14.16% |
| Merriman Vanguard Equity | 11.71% | 13.59% |
| IFA’s Vanguard Version of 100 | 10.82% | 14.39% |
| Coffeehouse Equity Only | 10.72% | 12.97% |
| Bernstein Cowards Equity Only | 10.08% | 13.37% |
| Vanguard Funds 60 Proxy | 9.61% | 8.93% |
| David Swensen | 9.18% | 10.23% |
| Coffeehouse | 9.01% | 7.53% |
| Ted Aronson | 8.59% | 11.85% |
| Bernstein | 8.25% | 7.62% |
| Frank Armstrong’s Ideal Indexes | 8.11% | 9.06% |
| Andrew Tobias Lazy | 6.82% | 7.72% |
| Andrew Tobias Lazy Equity Only | 6.00% | 13.81% |
Now, sorted by lowest risk:
| Lazy Portfolio | Return | Risk |
| Coffeehouse | 9.01% | 7.53% |
| Bernstein | 8.25% | 7.62% |
| Andrew Tobias Lazy | 6.82% | 7.72% |
| Vanguard Funds 60 Proxy | 9.61% | 8.93% |
| Frank Armstrong’s Ideal Indexes | 8.11% | 9.06% |
| David Swensen | 9.18% | 10.23% |
| Scott Burns Six Ways from Sunday | 13.39% | 10.81% |
| Ted Aronson | 8.59% | 11.85% |
| Scott Burns Six Ways from Sunday Equity Only | 15.92% | 12.25% |
| IFA IndexFolio 90 | 13.28% | 12.89% |
| Coffeehouse Equity Only | 10.72% | 12.97% |
| Bernstein Cowards Equity Only | 10.08% | 13.37% |
| Merriman Vanguard Equity | 11.71% | 13.59% |
| Andrew Tobias Lazy Equity Only | 6.00% | 13.81% |
| Mad Money Machine Do It Yourself | 12.82% | 14.16% |
| IFA’s Vanguard Version of 100 | 10.82% | 14.39% |
| IFA IndexFolio 100 | 13.97% | 14.47% |
You might enjoy seeing it as a scatter plot:
Now take a look at the same kind of chart only over a longer time span and INCLUDING THE DOW JONES 30 STOCKS!
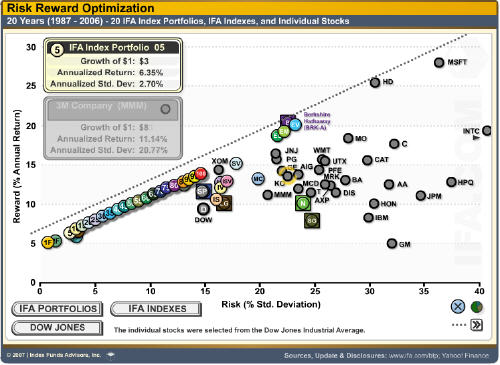
Going farther to the right means you are taking on more risk. Basically, you want to find an investment at the upper left. The line that crosses from lower left to upper right is the “Efficient Frontier.” I think this is one of the most important concepts to understand in all of investing. That is why the icon for the Mad Money Machine incorporates it.
![]()
Note: I cannot guarantee the accuracy of these results. More likely, I might guarantee there is a mistake somewhere. But in general, the numbers give a good idea of the relative risk vs. reward results. No taxes or advisor fees were removed from the results.

Quick question on std deviation – how do we account for dividends (or fund distributions)? I don’t see how this “counts” in total returns, but it doesn’t “count” in risk.
Not sure I understand the question, so let me answer it anyway 🙂
I used Yahoo “Adjusted” quotes, which incorporates the reinvestment of dividends. So they are included in both the total returns and the standard deviation of returns.
That answered it.
Would you be willing to share the spreadsheet you talked about (or at least tell my how you created it)?
I have recently been reading about “lazy portfolios” and am would like to be able to analyze potential retunrs/risks over time for portfolios made up of different holdings. It sounds like the spreadsheet you created would be a huge help in that.
Thanks.
Robert