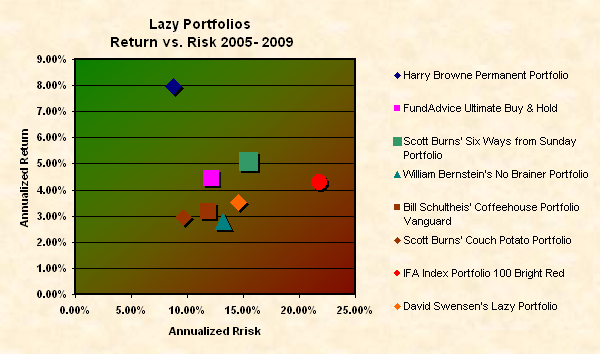
Lazy Portfolio 2005 – 2009 Return vs. Risk Chart
Let’s go back and gather up the gains for 2005 and 2006 to add to our analysis with this chart.

As you can see, the Harry Browne Permanent Portfolio still has the best “top-leftedness” of these select Lazy Portfolios. It had an annualized return of 8% with an annualized standard deviation of 8.8%. That results in a nicely high Sharpe ratio of 0.75, assuming a risk-free rate of return of 1.37% for all 5 years (not likely).
The HBPP’s out-performance is due to the stellar performance of gold through all of these years. I am still not convinced this is the one for all seasons. So I will be performing some analysis of this portfolio for the years that were most favorable to equities and not gold and see how the HBPP would have held up.

 Join us on Facebook
 Follow us on Twitter