Backtest Portfolio Challenge
[Update: Corrected the image. Note that the Bogle portfolio is corrected in the Google Spreadsheet – to some extent.]
I have copied Simba’s Backtest Portfolio spreadsheet from the Bogleheads forum into a Google Spreadsheet that you can use to back test a portfolio of Vanguard mutual funds and compare their performance from 1972 – 2008 to the IFA Index Portfolios. Combine the funds any way you like and compare them against IFA’s twenty portfolios. I included the "returns" for gold there for your convenience.
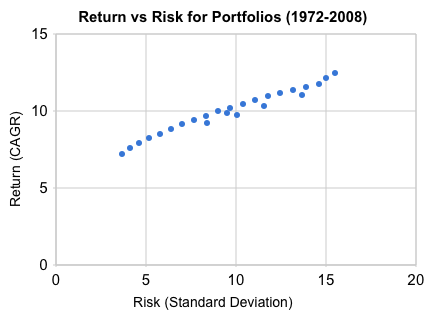
This graph from that spreadsheet shows the plots of a few others including the Coffeehouse portfolio, Harry Browne’s Permanent Portfolio, Scott Burns’ Four Square portfolio, and a couple of others along with IFA’s portfolios (they follow a nice line). Unfortunately, Google spreadsheets doesn’t do labeling very well on the data points. I would have liked each point to be colored and have a legend identifying those colors. Anyway, remember you want to be at a point at the top left on this graph. The line that is formed is called "The Efficient Frontier" beyond which it is difficult if not impossible to achieve. The strong correlation between returns and risk is evident. However, it is easy to be bottom right!
If you want to play with the spreadsheet yourself, feel free to bring it up. You’ll need a Google account. Leave the years to be 1972 – 2008 in order for the comparisons to be valid. Here’s the link:
https://spreadsheets.google.com/ccc?key=pOjc3ot10vgs0eml-DJZKcw&newcopy
But wait, there’s more!
IFA is now allowing you to submit your past financial statements to them so that they can compare you’re portfolio’s performance against their index portfolios. Go their web site at ifa.com to learn more. Here are some comparisons they have already performed.

 Join us on Facebook
 Follow us on Twitter