Was that a short-term bottom?
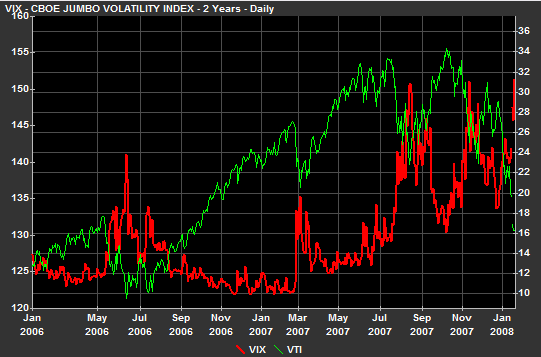
I can play trader just like all the other guys. For example, here is a chart comparing the Vanguard Total Stock Market ETF (VTI) in green versus the VIX, the volatility index in red (sorry color blind guys… the red is the bold line)
For the past two years, when the VIX spiked, it signaled a bottom for the VTI, which proceeded to move on upward at least for the short term. Today the VIX spiked up to 37. Did we bottom out this morning with someone selling their VTI shares at $120? (Most VTI shares traded around $129 today).
For a hint at the next Guru Roulette winner, I’m reading Crash Proof. It is a good summary of what I’ve learned (and passed along to you) up to this point. I wish I had read it when it first came out, it would have saved me a lot of time (and possibly a lot of money).

 Join us on Facebook
 Follow us on Twitter