Lazy Portfolios Thru September 2010
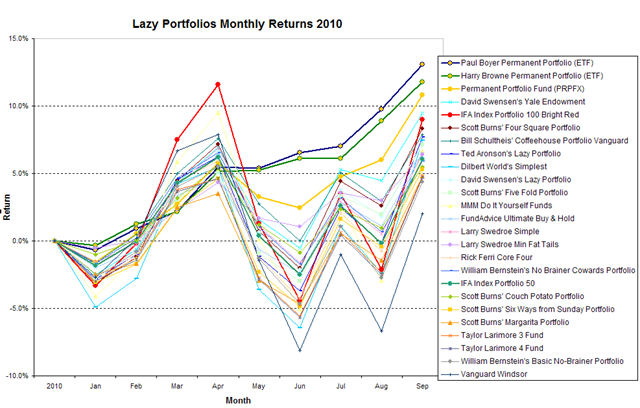
Here is a chart plotting the end-of-month returns for the lazy portfolios. Wow, what a roller coaster ride if your portfolio was 100% in stocks. On the other hand, wow, what a nice smooth ride if you were in one of the three permanent portfolios. The Paul Boyer Permanent Portfolio remains in the lead with an amazing 13.1% gain through the first three quarters of 2010. Look at that steady upward blue line! Thank you Harry Browne.
And here is the table of returns through September 2010:
| ID# | Portfolio Name | YTD Return |
| P2 | Paul Boyer Permanent Portfolio (ETF) | 13.1% |
| P1 | Harry Browne Permanent Portfolio (ETF) | 11.8% |
| P3 | Permanent Portfolio Fund (PRPFX) | 10.8% |
| P14 | David Swensen’s Yale Endowment | 9.5% |
| P24 | IFA Index Portfolio 100 Bright Red | 8.8% |
| P19 | Scott Burns’ Four Square Portfolio | 8.3% |
| P11 | Bill Schultheis’ Coffeehouse Portfolio Vanguard | 7.9% |
| P10 | Ted Aronson’s Lazy Portfolio | 7.7% |
| P9 | Dilbert World’s Simplest | 7.4% |
| P13 | David Swensen’s Lazy Portfolio | 7.2% |
| P20 | Scott Burns’ Five Fold Portfolio | 7.1% |
| P15 | MMM Do It Yourself Funds | 6.7% |
| P12 | FundAdvice Ultimate Buy & Hold | 6.5% |
| P22 | Larry Swedroe Simple | 6.4% |
| P23 | Larry Swedroe Min Fat Tails | 6.4% |
| P6 | Rick Ferri Core Four | 6.0% |
| P7 | William Bernstein’s No Brainer Cowards Portfolio | 5.9% |
| P25 | IFA Index Portfolio 50 | 5.9% |
| P17 | Scott Burns’ Couch Potato Portfolio | 5.5% |
| P21 | Scott Burns’ Six Ways from Sunday Portfolio | 5.3% |
| P18 | Scott Burns’ Margarita Portfolio | 4.8% |
| P4 | Taylor Larimore 3 Fund | 4.8% |
| P5 | Taylor Larimore 4 Fund | 4.7% |
| P8 | William Bernstein’s Basic No-Brainer Portfolio | 4.4% |
| P16 | Vanguard Windsor | 2.0% |
Data on IFA portfolios is courtesy of ifa.com. All other portfolio returns are calculated using Yahoo! Finance historical returns and may not include dividends paid in the most recent month.

 Join us on Facebook
 Follow us on Twitter