Lazy Portfolios Thru May 2010
Here are the Year-To-Date returns of the Lazy Portfolios through the end of May 2010. The components of each portfolio are listed at the end. The “Paul Boyer Permanent Portfolio” is my modification of the Harry Browne Permanent Portfolio where instead of investing 25% in the total US stock market, we invest 12.5% in US Small Cap Value and 12.5% in Emerging Markets.
| ID# | Portfolio Name | YTD Return |
| P2 | Paul Boyer Permanent Portfolio | 5.0% |
| P1 | Harry Browne Permanent Portfolio | 4.8% |
| P3 | Permanent Portfolio Fund | 3.3% |
| P11 | Bill Schultheis’ Coffeehouse Portfolio Vanguard | 2.6% |
| P23 | Larry Swedroe Min Fat Tails | 1.6% |
| P14 | David Swensen’s Yale Endowment | 1.6% |
| P24 | IFA Index Portfolio 100 Bright Red | 1.3% |
| P17 | Scott Burns’ Couch Potato Portfolio | 1.3% |
| P22 | Larry Swedroe Simple | 1.2% |
| P7 | William Bernstein’s No Brainer Cowards Portfolio | 0.9% |
| P19 | Scott Burns’ Four Square Portfolio | 0.8% |
| P13 | David Swensen’s Lazy Portfolio | 0.7% |
| P25 | IFA Index Portfolio 50 | 0.4% |
| P15 | MMM Do It Yourself Funds | 0.1% |
| P12 | FundAdvice Ultimate Buy & Hold | -0.7% |
| P20 | Scott Burns’ Five Fold Portfolio | -0.9% |
| P10 | Ted Aronson’s Lazy Portfolio | -1.2% |
| P6 | Rick Ferri Core Four | -1.2% |
| P8 | William Bernstein’s Basic No-Brainer Portfolio | -1.3% |
| P16 | Vanguard Windsor | -1.5% |
| P21 | Scott Burns’ Six Ways from Sunday Portfolio | -2.3% |
| P4 | Taylor Larimore 3 Fund | -2.8% |
| P5 | Taylor Larimore 4 Fund | -2.9% |
| P18 | Scott Burns’ Margarita Portfolio | -2.9% |
| P9 | Dilbert World’s Simplest | -3.6% |
Below is a Return vs. Risk Chart for these portfolios from 1985 through 2009 (Note: this chart does not include returns through the end of May 2010). The ideal portfolio would be high return at low risk and thus appear at the top left of the chart. [Chart data is computed using Simba’s spreadsheet from the Bogleheads.org forum with the exception of IFA portfolios from ifa.com.]
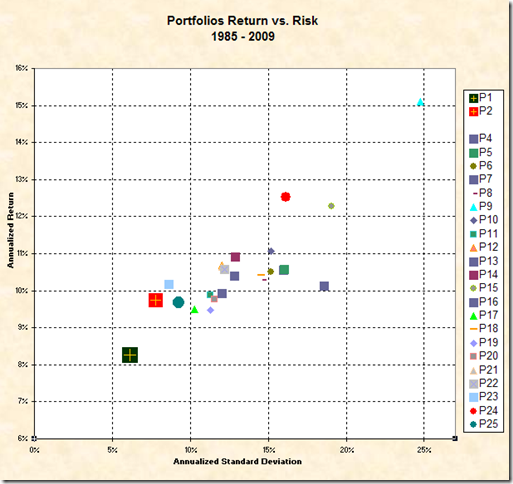
See how there is almost an invisible boundary line from lower left to upper right? That is the “Efficient Frontier” and shows that returns are correlated with risk over the long term. It is nearly impossible to construct a portfolio that will be above that efficient frontier. So the only question you need to answer is, how much risk are you willing to accept. That is, can you tolerate the downturns in the market in the short term?
Looking at a shorter term, here is a chart showing just the previous ten years from 2000 through 2009.
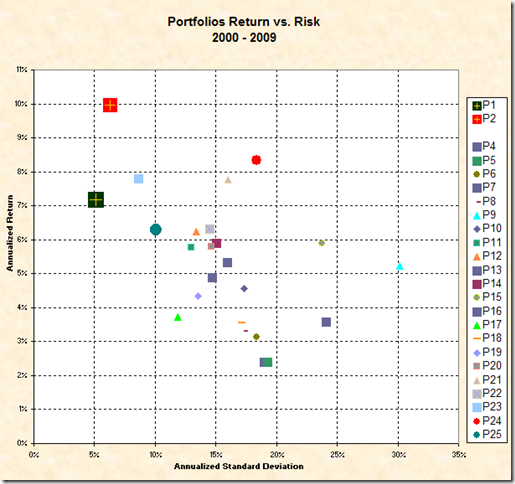
I like the boost to returns the Paul Boyer Permanent Portfolio got during prosperity and it didn’t hurt too much during recession either.
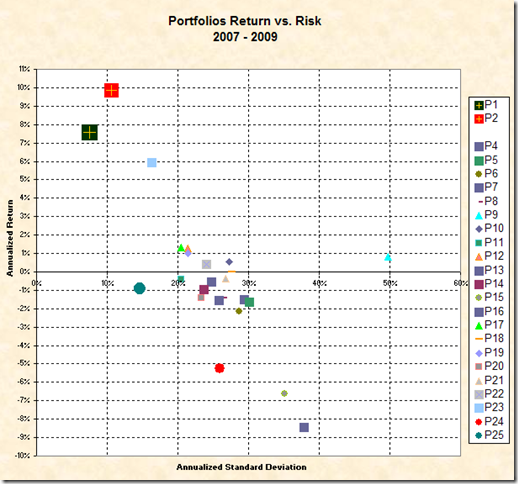
And to see if you can indeed stomach a bad short term, here is a chart with just the previous three years:
How about a chart of just the recent heyday of stocks from 2003 thru 2006:
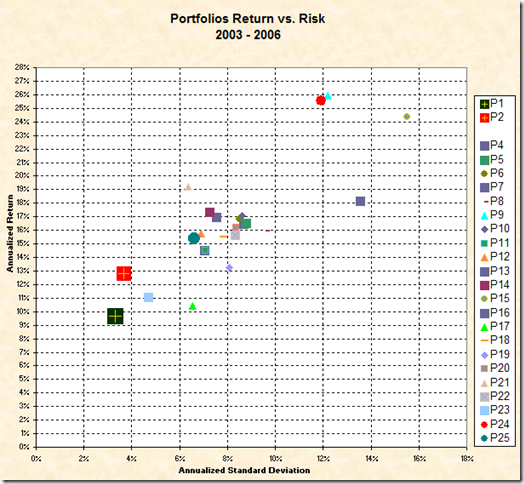
Looking at past charts is fun, but should not be the only data you use to make investment decisions. I like the Permanent Portfolio concept because it is so simple, has low fees, and covers the four economic cycles of prosperity, inflation, deflation, and recession. It has been shown to be the lowest in risk among the lazy portfolios while not sacrificing returns. They are the only portfolios to include gold.
Here are the components of each of the portfolios*:
| YTD | ||||
| ID# | PORTFOLIO NAME | TICKER | % | Return |
| P1 | Harry Browne Permanent Portfolio | |||
| Vanguard Total Stock Mkt Idx | VTSMX | 25% | -0.4% | |
| Vanguard Long-Term Treasury Investor | VUSTX | 25% | 7.3% | |
| Vanguard Short-Term Treasury | VFISX | 25% | 1.4% | |
| SPDR Gold Shares | GLD | 25% | 10.8% | |
| TOTAL | 100% | 4.8% | ||
| P2 | Paul Boyer Permanent Portfolio | |||
| Vanguard Small Cap Value Index | VISVX | 12.5% | 7.7% | |
| Vanguard Emerging Mkts Stock Idx | VEIEX | 12.5% | -6.9% | |
| Vanguard Long-Term Treasury Investor | VUSTX | 25% | 7.3% | |
| Vanguard Short-Term Treasury | VFISX | 25% | 1.4% | |
| SPDR Gold Shares | GLD | 25% | 10.8% | |
| TOTAL | 100% | 5.0% | ||
| P3 | Permanent Portfolio Fund | PRPFX | 100% | 3.3% |
| P4 | Taylor Larimore 3 Fund | |||
| Vanguard Total Intl Stock Index | VTSMX | 50% | -0.4% | |
| Vanguard Short-Term Bond Index | VGTSX | 30% | -11.0% | |
| Vanguard Total Bond Market Index | VBMFX | 20% | 3.2% | |
| TOTAL | 100% | -2.8% | ||
| P5 | Taylor Larimore 4 Fund | |||
| Vanguard Total Intl Stock Index | VTSMX | 50% | -0.4% | |
| Vanguard Short-Term Bond Index | VGTSX | 30% | -11.0% | |
| Vanguard Total Bond Market Index | VBMFX | 10% | 3.2% | |
| Vanguard Inflation-Protected Secs | VIPSX | 10% | 2.9% | |
| TOTAL | 100% | -2.9% | ||
| P6 | Rick Ferri Core Four | |||
| Vanguard Total Intl Stock Index | VTSMX | 48% | -0.4% | |
| Vanguard REIT Index | VGSIX | 8% | 11.5% | |
| Vanguard Total Intl Stock Index | VGTSX | 24% | -11.0% | |
| Vanguard Total Bond Market Index | VBMFX | 20% | 3.2% | |
| TOTAL | 100% | -1.2% | ||
| P7 | William Bernstein’s No Brainer Cowards Portfolio | |||
| Vanguard Short-Term Investment-Grade | VFSTX | 40% | 1.7% | |
| Vanguard Total Stock Mkt Idx | VTSMX | 15% | -0.4% | |
| Vanguard Small Cap Value Index | VISVX | 10% | 7.7% | |
| Vanguard Value Index | VIVAX | 10% | -0.4% | |
| Vanguard Emerging Mkts Stock Idx | VEIEX | 5% | -6.9% | |
| Vanguard European Stock Index | VEURX | 5% | -16.0% | |
| Vanguard Pacific Stock Index | VPACX | 5% | -4.8% | |
| Vanguard REIT Index | VGSIX | 5% | 11.5% | |
| Vanguard Tax-Managed Small Cap Inv | VTMSX | 5% | 6.7% | |
| TOTAL | 100% | 0.9% | ||
| P8 | William Bernstein’s Basic No-Brainer Portfolio | |||
| Vanguard 500 Index | VFINX | 25% | -1.5% | |
| Vanguard Tax-Managed Small Cap Inv | VTMSX | 25% | 6.7% | |
| Vanguard Tax-Managed Intl | VTMGX | 25% | -12.2% | |
| Vanguard Short-Term Bond Index | VBISX | 25% | 1.7% | |
| TOTAL | 100% | -1.3% | ||
| P9 | Dilbert World’s Simplest | |||
| Vanguard Total Intl Stock Index | VTSMX | 50% | -0.4% | |
| Vanguard Short-Term Bond Index | VEIEX | 50% | -6.9% | |
| TOTAL | 100% | -3.6% | ||
| P10 | Ted Aronson’s Lazy Portfolio | |||
| Vanguard Emerging Mkts Stock Idx | VEIEX | 20% | -6.9% | |
| Vanguard 500 Index | VFINX | 15% | -1.5% | |
| Vanguard Pacific Stock Index | VPACX | 15% | -4.8% | |
| Vanguard Extended Market Idx | VEXMX | 10% | 5.7% | |
| Vanguard Inflation-Protected Secs | VIPSX | 10% | 2.9% | |
| Vanguard European Stock Index | VEURX | 5% | -16.0% | |
| Vanguard High-Yield Corporate | VWEHX | 5% | 0.4% | |
| Vanguard Long-Term U.S. Treasury | VUSTX | 5% | 7.3% | |
| Vanguard Small Cap Growth Index | VISGX | 5% | 5.8% | |
| Vanguard Small Cap Value Index | VISVX | 5% | 7.7% | |
| Vanguard Total Stock Mkt Idx | VTSMX | 5% | -0.4% | |
| TOTAL | 100% | -1.2% | ||
| P11 | Bill Schultheis’ Coffeehouse Portfolio Vanguard | |||
| Vanguard Total Bond Market Index | VBMFX | 40% | 3.2% | |
| Vanguard 500 Index | VFINX | 10% | -1.5% | |
| Vanguard Value Index | VIVAX | 10% | -0.4% | |
| Vanguard Total Intl Stock Index | VGTSX | 10% | -11.0% | |
| Vanguard REIT Index | VGSIX | 10% | 11.5% | |
| Vanguard Small Cap Value Index | VISVX | 10% | 7.7% | |
| Vanguard Small Cap Index | NAESX | 10% | 6.7% | |
| TOTAL | 100% | 2.6% | ||
| P12 | FundAdvice Ultimate Buy & Hold | |||
| Vanguard 500 Index | VFINX | 6.00% | -1.5% | |
| Vanguard Value Index | VIVAX | 6.00% | -0.4% | |
| Vanguard Small Cap Index | NAESX | 6.00% | 6.7% | |
| Vanguard Small Cap Value Index | VISVX | 6% | 7.7% | |
| Vanguard REIT Index | VGSIX | 6% | 11.5% | |
| Vanguard Developed Markets Index | VDMIX | 12% | -12.1% | |
| Vanguard Inflation-Protected Secs | VIPSX | 8% | 2.9% | |
| Vanguard Interm-Term U.S. Treas | VFITX | 20% | 4.1% | |
| Vanguard Short-Term Treasury | VFISX | 12% | 1.4% | |
| Vanguard International Value | VTRIX | 12% | -12.7% | |
| Vanguard Emerging Mkts Stock Idx | VEIEX | 6% | -6.9% | |
| TOTAL | 100.00% | -0.7% | ||
| P13 | David Swensen’s Lazy Portfolio | |||
| Vanguard Total Stock Mkt Idx | VTSMX | 30% | -0.4% | |
| Vanguard REIT Index | VGSIX | 20% | 11.5% | |
| Vanguard Developed Markets Index | VDMIX | 15% | -12.1% | |
| Vanguard Emerging Mkts Stock Idx | VEIEX | 5% | -6.9% | |
| Vanguard Inflation-Protected Secs | VIPSX | 15% | 2.9% | |
| Vanguard Short-Term Treasury | VFISX | 15% | 1.4% | |
| TOTAL | 100% | 0.7% | ||
| P14 | David Swensen’s Yale Endowment | |||
| Vanguard Total Stock Mkt Idx | VTSMX | 30% | -0.4% | |
| Vanguard REIT Index | VGSIX | 20% | 11.5% | |
| Vanguard Developed Markets Index | VDMIX | 15% | -12.1% | |
| Vanguard Emerging Mkts Stock Idx | VEIEX | 5% | -6.9% | |
| Vanguard Inflation-Protected Secs | VIPSX | 15% | 2.9% | |
| Vanguard Short-Term Treasury | VUSTX | 15% | 7.3% | |
| TOTAL | 100% | 1.6% | ||
| P15 | MMM Do It Yourself Funds | |||
| Vanguard 500 Index | VFINX | 12.00% | -1.5% | |
| Vanguard Value Index | VIVAX | 12.00% | -0.4% | |
| Vanguard Small Cap Value Index | VISVX | 20.00% | 7.7% | |
| Bridgeway Ultra-Small Company Market | BRSIX | 20.00% | 6.4% | |
| Vanguard REIT Index | VGSIX | 5.00% | 11.5% | |
| Vanguard International Value | VTRIX | 9.00% | -12.7% | |
| Vanguard International Explorer | VGTSX | 9.00% | -11.0% | |
| Vanguard Emerging Mkts Stock Idx | VEIEX | 13.00% | -6.9% | |
| TOTAL | 100.00% | 0.1% | ||
| P16 | Vanguard Windsor | VWNDX | 100.00% | -1.5% |
| P17 | Scott Burns’ Couch Potato Portfolio | |||
| Vanguard Total Stock Mkt Idx | VTSMX | 50% | -0.4% | |
| Vanguard Inflation-Protected Secs | VIPSX | 50% | 2.9% | |
| TOTAL | 100% | 1.3% | ||
| P18 | Scott Burns’ Margarita Portfolio | |||
| Vanguard Total Stock Mkt Idx | VTSMX | 33.30% | -0.4% | |
| Vanguard Inflation-Protected Secs | VIPSX | 33.30% | 2.9% | |
| Vanguard Total Intl Stock Index | VGTSX | 33.30% | -11.0% | |
| TOTAL | 99.90% | -2.9% | ||
| P19 | Scott Burns’ Four Square Portfolio | |||
| Vanguard Total Stock Mkt Idx | VTSMX | 25% | -0.4% | |
| Vanguard Inflation-Protected Secs | VIPSX | 25% | 2.9% | |
| Vanguard Total Intl Stock Index | VGTSX | 25% | -11.0% | |
| Vanguard REIT Index | VGSIX | 25% | 11.5% | |
| TOTAL | 100% | 0.8% | ||
| P20 | Scott Burns’ Five Fold Portfolio | |||
| Vanguard Total Stock Mkt Idx | VTSMX | 20% | -0.4% | |
| Vanguard Inflation-Protected Secs | VIPSX | 20% | 2.9% | |
| Vanguard Total Intl Stock Index | VGTSX | 20% | -11.0% | |
| Vanguard REIT Index | VGSIX | 20% | 11.5% | |
| American Century International Bd Inv | BEGBX | 20% | -7.4% | |
| TOTAL | 100% | -0.9% | ||
| P21 | Scott Burns’ Six Ways from Sunday Portfolio | |||
| Vanguard Total Stock Mkt Idx | VTSMX | 16.7% | -0.4% | |
| Vanguard Inflation-Protected Secs | VIPSX | 16.7% | 2.9% | |
| Vanguard Total Intl Stock Index | VGTSX | 16.7% | -11.0% | |
| Vanguard REIT Index | VGSIX | 16.7% | 11.5% | |
| American Century International Bd Inv | BEGBX | 16.7% | -7.4% | |
| Vanguard Energy | VGENX | 16.7% | -9.2% | |
| TOTAL | 100.0% | -2.3% | ||
| P22 | Larry Swedroe Simple | |||
| Vanguard Value Index | VIVAX | 15% | -0.4% | |
| Vanguard Small Cap Value Index | VISVX | 15% | 7.7% | |
| Vanguard Small Cap Index | NAESX | 13% | 6.7% | |
| Vanguard Emerging Mkts Stock Idx | VEIEX | 4% | -6.9% | |
| Vanguard International Value Inv | VTRIX | 13% | -12.7% | |
| Vanguard Inflation-Protected Secs | VIPSX | 40% | 2.9% | |
| TOTAL | 100% | 1.2% | ||
| P23 | Larry Swedroe Min Fat Tails | |||
| Vanguard Small Cap Value Index | VISVX | 15% | 7.7% | |
| Vanguard Emerging Mkts Stock Idx | VEIEX | 15% | -6.9% | |
| Vanguard Inflation-Protected Secs | VIPSX | 35% | 2.9% | |
| Vanguard Short-Term Treasury | VFISX | 35% | 1.4% | |
| TOTAL | 100% | 1.6% | ||
| P24 | IFA Index Portfolio 100 Bright Red | |||
| DFA U.S. Large Company | DFLCX | 12% | 0.0% | |
| DFA U.S. Large Cap Value | DFLVX | 12% | 3.8% | |
| DFA U.S. Micro Cap | DFSCX | 20% | 8.7% | |
| DFA U.S. Small Cap Value | DFSVX | 20% | 9.0% | |
| DFA Real Estate Securities | DFREX | 5% | 11.7% | |
| DFA Intl Value | DFIVX | 6% | -11.6% | |
| DFA Intl Small Company | DFISX | 6% | -5.7% | |
| DFA Intl Small Cap Value | DISVX | 6% | -8.0% | |
| DFA Emerging Markets | DFEMX | 4% | -5.5% | |
| DFA Emerging Markets Value | DFEVX | 4% | -6.8% | |
| DFA Emerging Markets Small Cap | DEMSX | 5% | -3.6% | |
| TOTAL | 100% | 1.32%* | ||
| P25 | IFA Index Portfolio 50 | |||
| DFA U.S. Large Company | DFLCX | 12% | 0.0% | |
| DFA U.S. Large Cap Value | DFLVX | 12% | 3.8% | |
| DFA U.S. Micro Cap | DFSCX | 6% | 8.7% | |
| DFA U.S. Small Cap Value | DFSVX | 6% | 9.0% | |
| DFA Real Estate Securities | DFREX | 6% | 11.7% | |
| DFA Intl Value | DFIVX | 6% | -11.6% | |
| DFA Intl Small Company | DFISX | 3% | -5.7% | |
| DFA Intl Small Cap Value | DISVX | 3% | -8.0% | |
| DFA Emerging Markets | DFEMX | 2% | -5.5% | |
| DFA Emerging Markets Value | DFEVX | 2% | -6.8% | |
| DFA Emerging Markets Small Cap | DEMSX | 2% | -3.6% | |
| DFA One-Year Fixed-Income I | DFIHX | 10% | 0.4% | |
| DFA Two-Year Global Fixed-Income I | DFGFX | 10% | 0.8% | |
| DFA Five-Year Government I | DFFGX | 10% | 2.3% | |
| DFA Five-Year Global Fixed-Income I | DFGBX | 10% | 3.2% | |
| TOTAL | 100% | 0.36%* | ||
*Note that these results use Yahoo! Finance adjusted historical returns with the exception of IFA portfolios results from IFA.com that include IFA’s fee.

 Join us on Facebook
 Follow us on Twitter